Area Charts
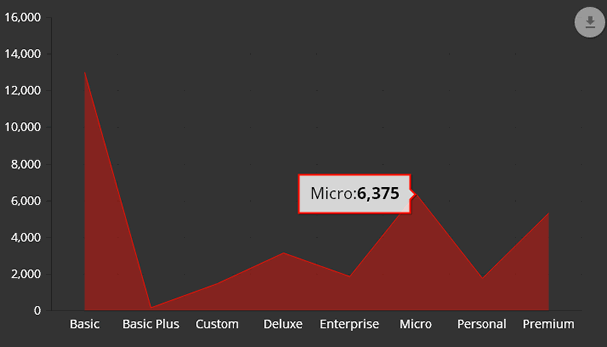
Output

There are two ways of creating charts
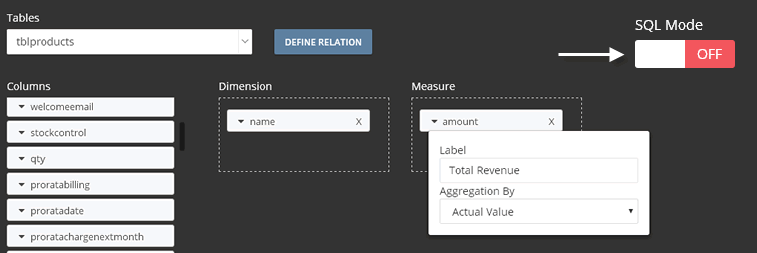
1. Drag and Drop
- Dimension (Drag one column)
- Measure column (Drag one numeric column) Measure column can be used aggregarated function like sum, count, avg

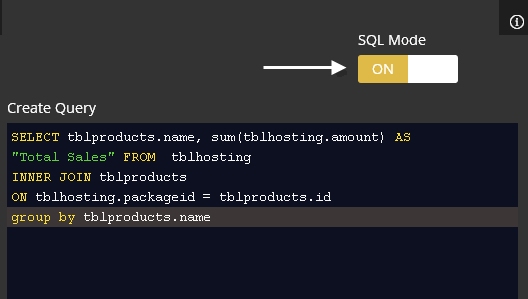
2. SQL Query

Example:
SELECT COL1, COL2 FROM TABLE GROUP BY COL1
In the above SQL query, COL1 is dimension column and COL2 is the numeric column.
In SQL mode their is also citql tag support so you can able to add filters to your charts.