Turn your Data into Visual Insight
Auto Table Joins

Join tables quickly and easily using our point-and-click Table Relation builder
All join types and unlimited joing. Or use our Data Model feature to load your most common queries.
- Table Relation UI
- Data Models (Stored Queries)
- SQL
- Point and Click
- Tabular Reports
- Pivot Table Reports
- Running Summary Reports
- Single Value (Number) Reports
SQL (or Not)

Turn SQL into reports from any data source.
Reports can be built via SQL or drop-and-drag. Query across data sources, employ Data Models, and Data Stores to make your reporting more productive.
Reports can be exported to PDF, Excel (CSV), as well as shared via secure link or embedded in web applications.
Drop and Drag Formatting
True What-You-See-Is-What-You-Get (WYSIWYG) report formatting.
The report or entires dashboard will be exported to PDF exactly as it appears on the screen in fron of you!
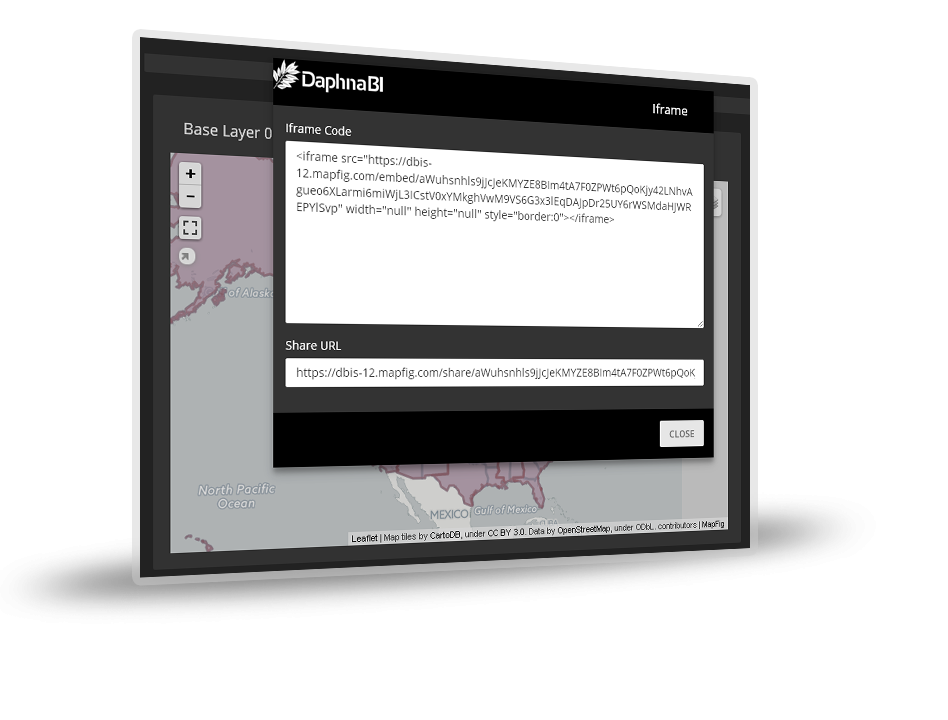
Free Hand Maps
Export to PDF and CSV and other formats.
Share via secure link
Embed in web applications
Export and share entire dashboards or single report elements.